Diving into CELS Index composition
New Energy Weekly Wrap - Jun 3, 2022

Besides the weekly new energy market summary, this week we will take a look at the composition of CELS index.
Market summary
Clean energy stocks had a mixed performance last week. While the NASDAQ Clean Edge Green Energy Index (CELS) was down slightly on the week, the 0.6% w-o-w loss outperformed the 1.2% loss on the S&P 500. YTD, CELS is down 17.2% underperforming the 13.8% loss on the S&P 500.

The S&P 500 had a rocky week, and ultimately ended the week lower. US payrolls number for May at 390K addition (vs. consensus estimate of 318K) was strong, and market interpreted this as providing further support to the Fed’s plan to raise raises by 50bps each at the next two FOMC meetings.
Among clean energy sectors, the PV supply chain companies such $DQ and $FSLR outperformed, while materials companies such as $ALB and $MP lagged the other sectors in CELS index.
Winners and losers
Within CELS, last week’s best performer was Daqo New Energy Corp, $DQ with a 16% gain, likely due to a board authorized buyback program of up to $120mm. $DQ manufactures polysilicon to PV product manufacturers who process it into ingots, wafers, cells and modules for solar power products.
The week’s laggard was Livent Corp $LTHM, with a 18% loss. $LTHM produces and distributes lithium compounds.
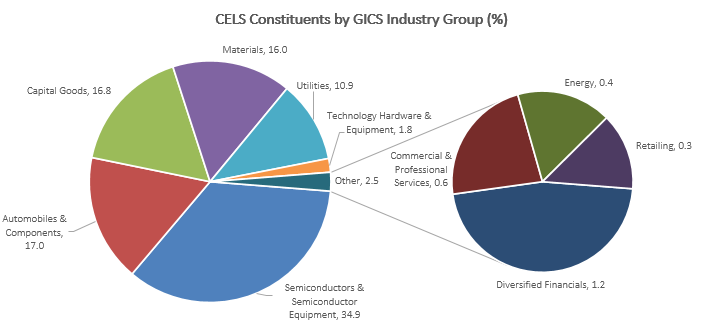
CELS constituent composition
This week, we dive briefly into the industries/sectors composition of CELS index, to add more context to the weekly performances I have been reporting. I used the GICS industry group classification, which is an industry classification standard developed by MSCI in collaboration with Standard & Poors. GICS consists of 11 sectors and 24 industry groups.
The 65 stock constituents of CELS index represent 10 industry groups as of March 2022 update. PV supply chain companies (GICS industry group: Semiconductors & Semiconductor Equipment) constitute the biggest industry composition at 34.9% with 14 stocks. On Semiconductor Corp $ON holds the largest constituent weight from this group. This is followed by Automobiles & Components, which constitute 17.0% with 5 stocks. $TSLA at 7.1% and $NIO at 6.7% hold the two largest constituent weights from this group.
The pie chart below breaks down the weights across all 10 industry groups, while the following table counts the number of stocks by each industry group.